

Performance Max 101: Why Most Businesses Fail With Google's Most Powerful Campaign Type
Google's Performance Max campaigns promise unprecedented reach across the search giant's entire ecosystem. Yet after managing over $15 million in Performance Max spend, we've discovered most businesses struggle to harness its potential. The reason isn't complicated: Performance Max requires a fundamentally different strategic approach than traditional Google campaign types.
Why Most Businesses Waste Their First $10,000 in Google Search Ads (And How to Avoid It)
Most businesses without proper search advertising training burn through their first $5,000-$10,000 in ad spend with little to show for it. This isn't because Google Ads doesn't work. It's because most businesses approach it with dangerous overconfidence and a fundamental misunderstanding of how the platform actually drives profitable results.

The Hidden Price of DIY Funnel Marketing
When business owners attempt to create marketing funnels from scratch, they rarely calculate the full cost involved. People forget to factor in the cost of their own time and the opportunity cost of not focusing on what they’re most effective at. This article covers some of the forgotten and even hidden costs of DIYing everything yourself and some ways to reduce those costs.

Why Smart Marketers Use Proven Ad Templates
In the high-stakes world of paid social advertising, every dollar counts. Every impression matters. Every click represents potential revenue. Yet surprisingly, many businesses approach their paid advertising creative with a dangerous mix of guesswork, aesthetics-first thinking, and untested assumptions—a recipe for wasted ad spend and missed opportunities.

Why Starting from Scratch is a Costly Mistake in Social Media Branding
In the fast-paced world of digital marketing, time is your most valuable currency. Yet, countless entrepreneurs and small business owners make the same critical error day after day: attempting to create social media content from scratch. If you're nodding along, thinking about the countless hours you've spent staring at a blank Canva screen, this article is your wake-up call.

The Significance of Site Design and UX in Converting Customers
This article highlights the crucial role of user-centric design in creating a positive and successful online shopping experience and goes a step further in providing concrete points to consider when building your own site.
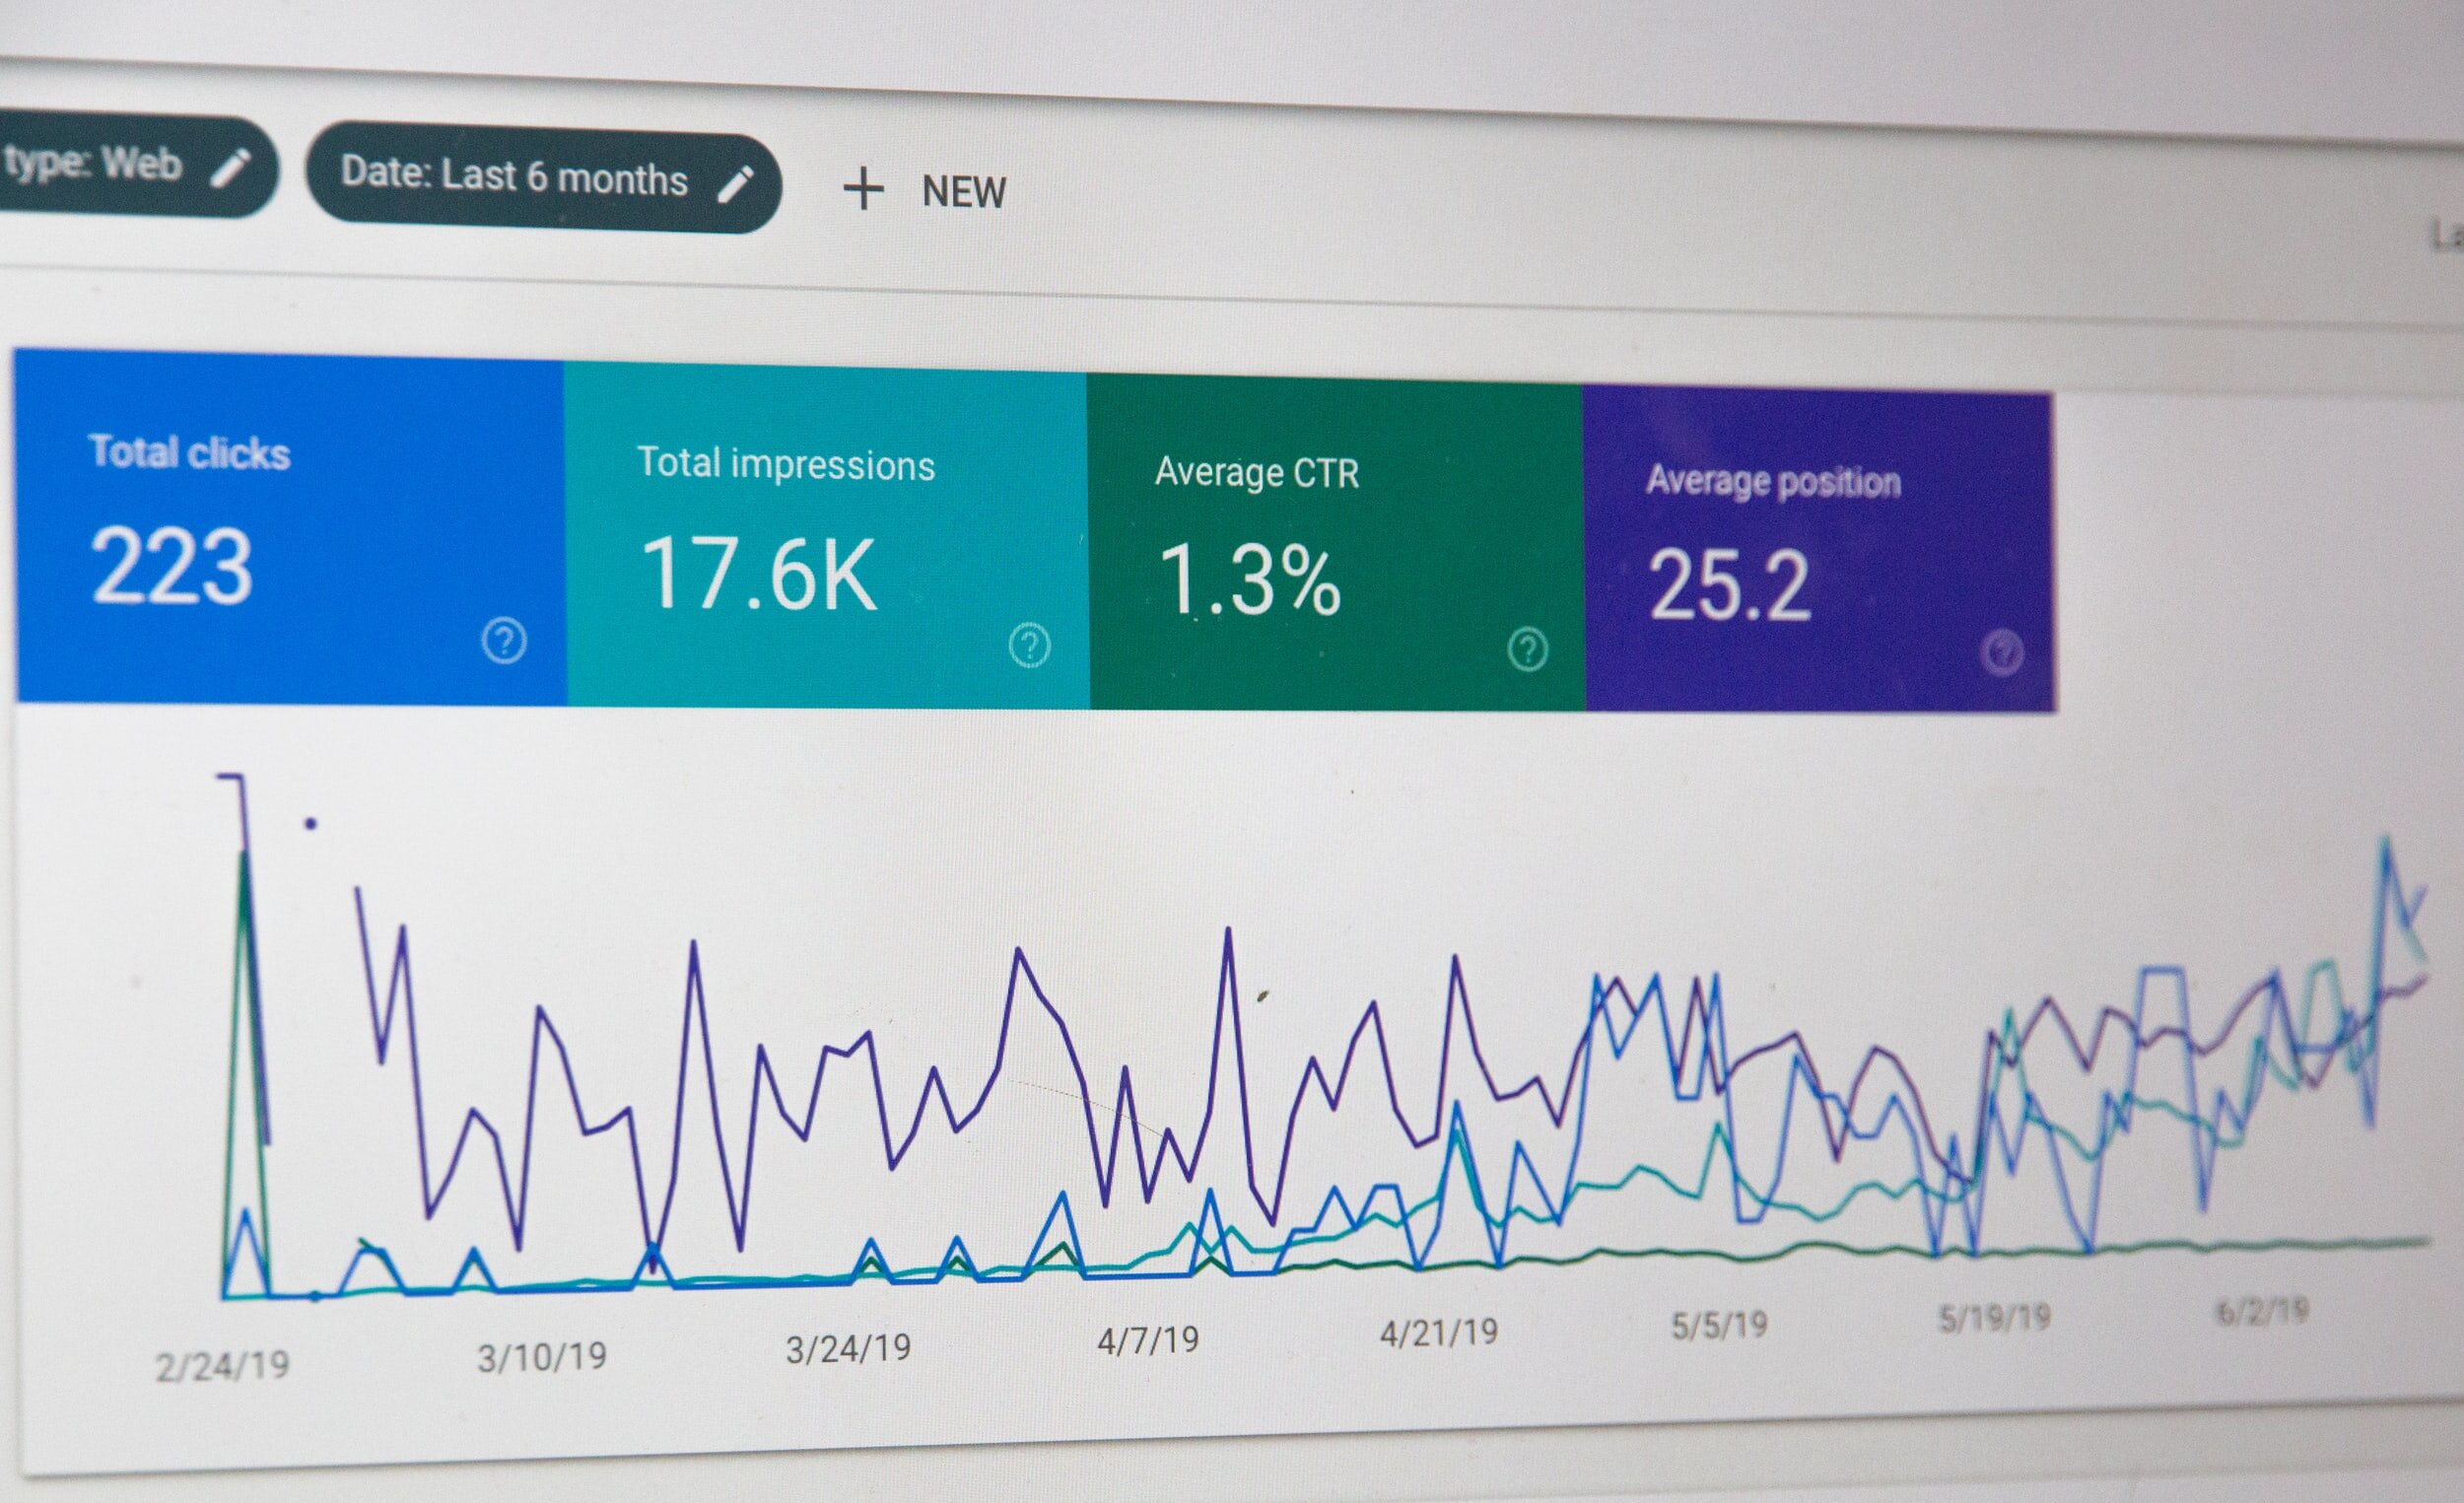
Analytics Essentials: Building a Functional KPI Dashboard
Data is crucial for smart business choices, but the sheer volume can be overwhelming.
The key? Focus on the most important information and present it clearly. This might involve simplifying it for those unfamiliar with the data. One great way to achieve this is by creating a dashboard. Think of it as a one-stop shop for all your data visualizations, making things easy to grasp for everyone.
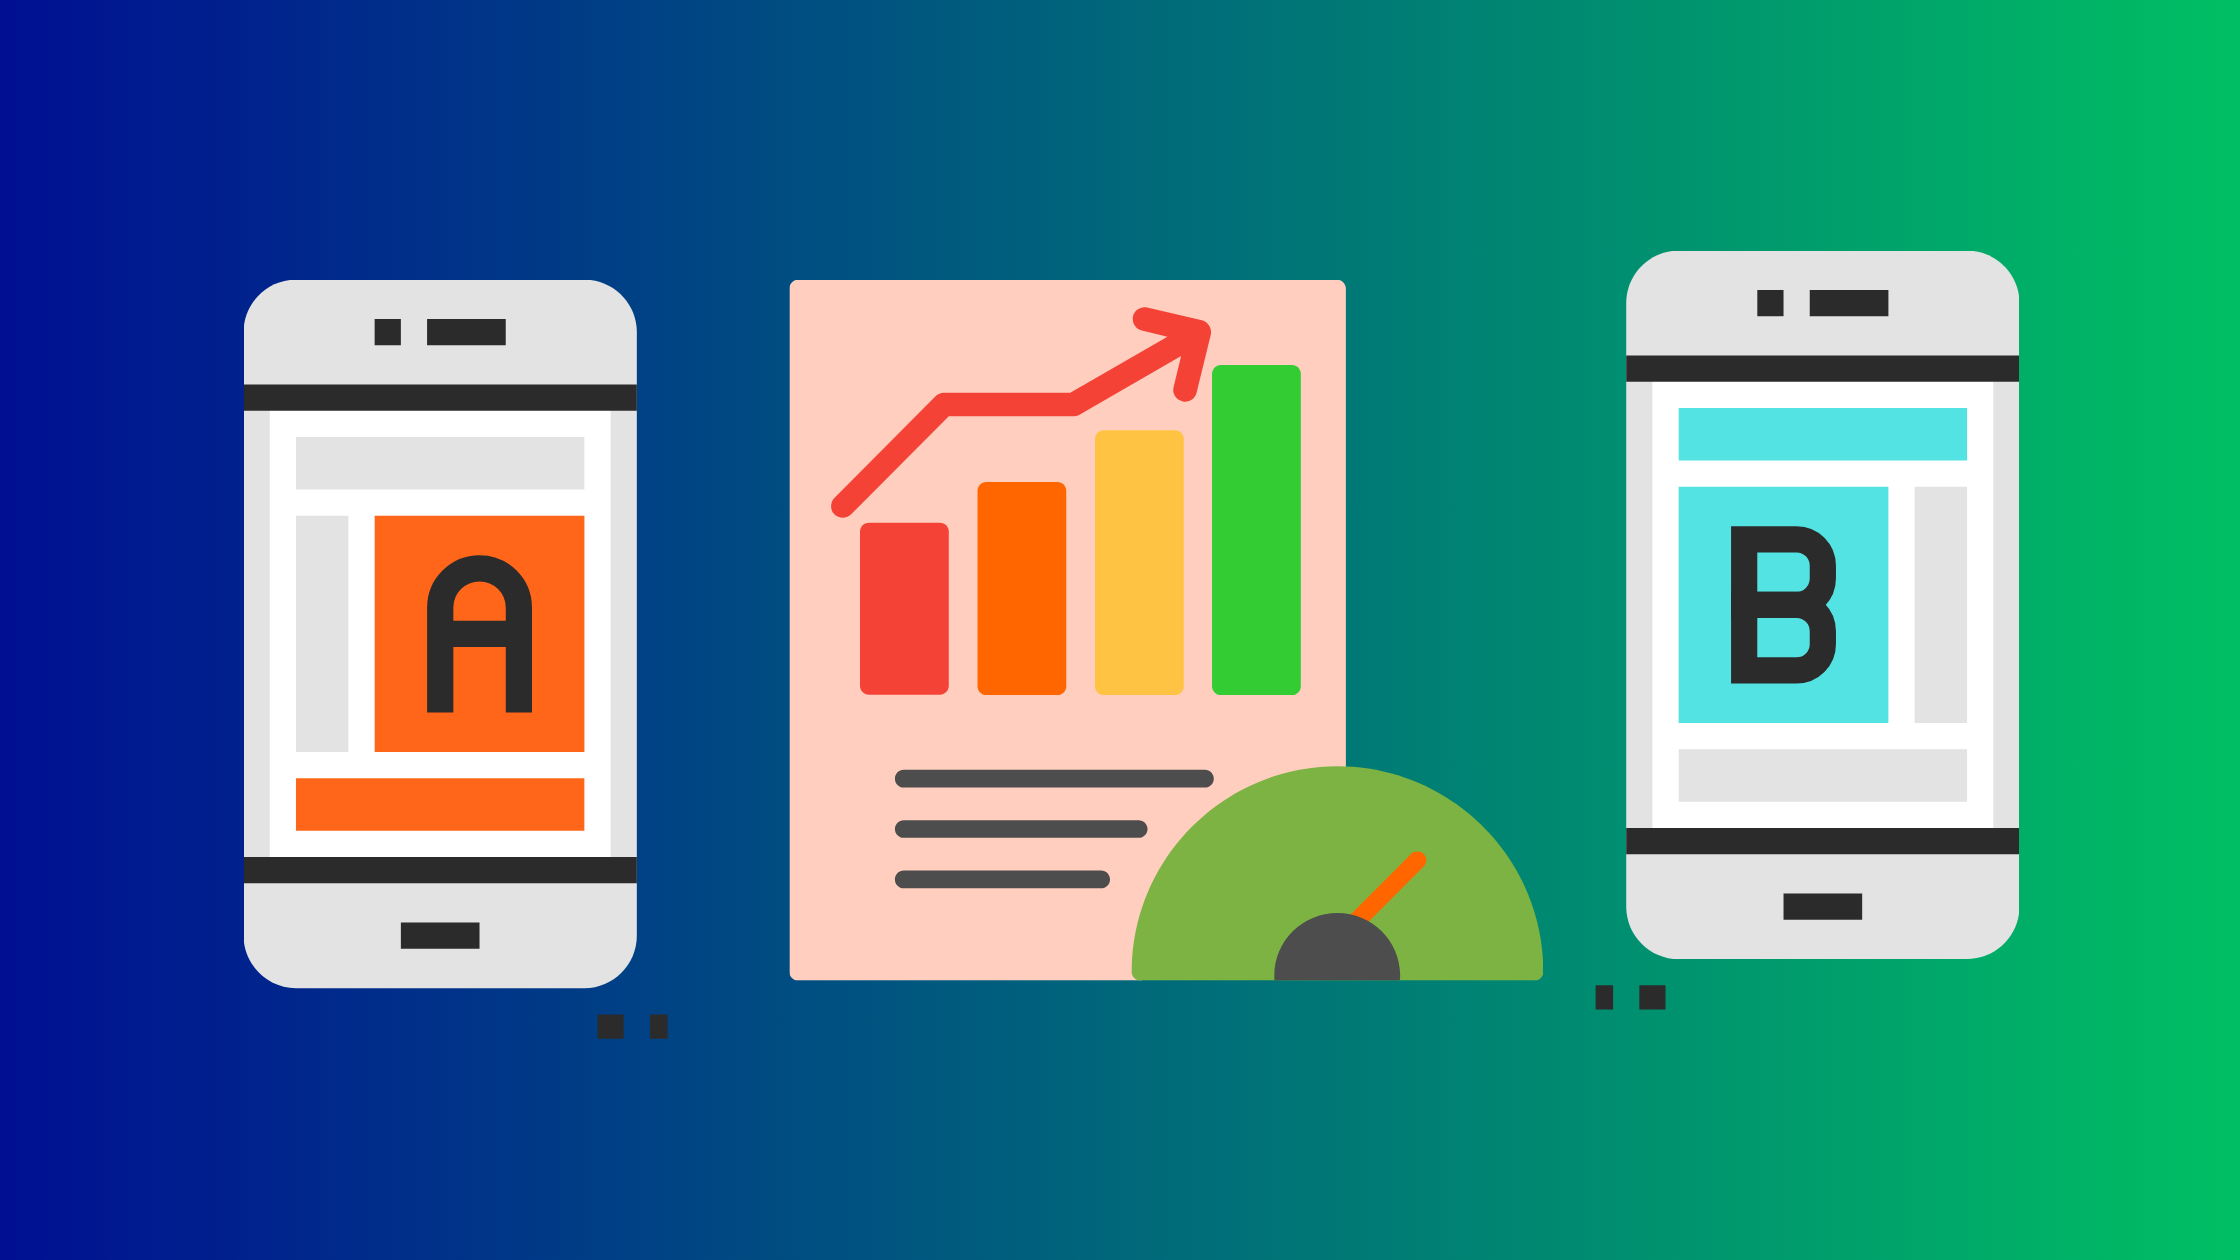
Analytics Essentials: Introduction to A/B Testing
A/B testing is a powerful tool that empowers you to move beyond guesswork and optimize your marketing efforts for success. This guide explains what A/B testing is, how to set up an A/B test, and the role of statistical significance in analyzing results.

Analytics Essentials: Website Analytics and Conversion Rate Optimization 101
By effectively utilizing website analytics and CRO strategies, you can transform your website from a passive brochure into a powerful revenue generation machine. This article is a guide on how to get started with website analytics and conversion rate optimization to set you on the path of success.
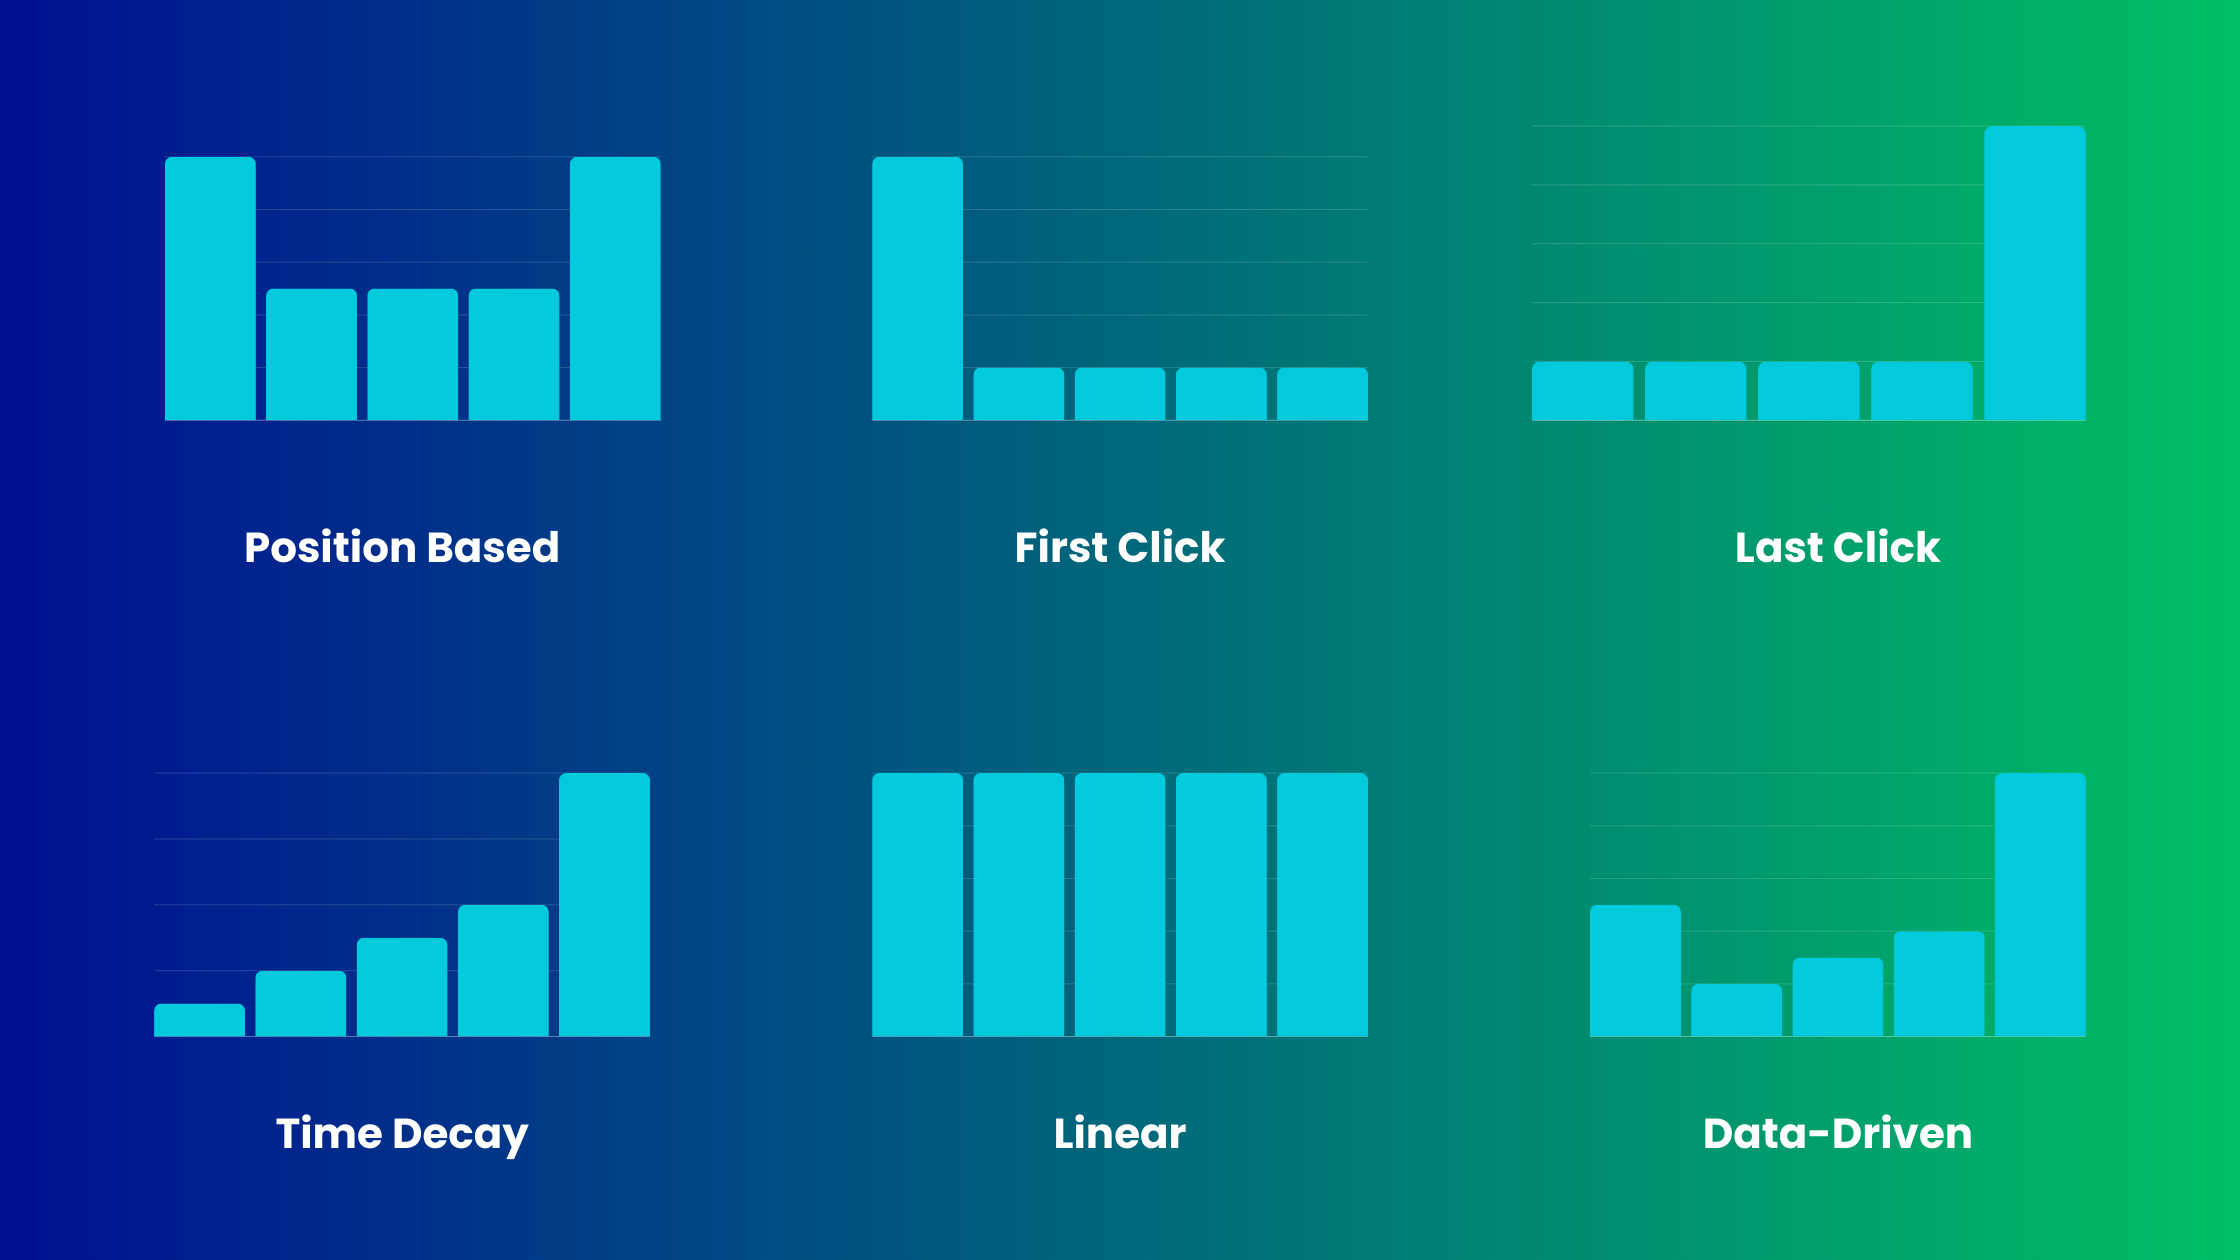
Analytics Essentials: Attribution Models - What They Are & How To Choose One
Attribution models are the key to understanding which marketing channels and campaigns are truly driving customers to your business. By tracking and assigning credit for conversions, you can confidently invest in the strategies that demonstrate the greatest return on investment (ROI). This blog will guide you through the various types of attribution models out there and how to choose the right one for your business.
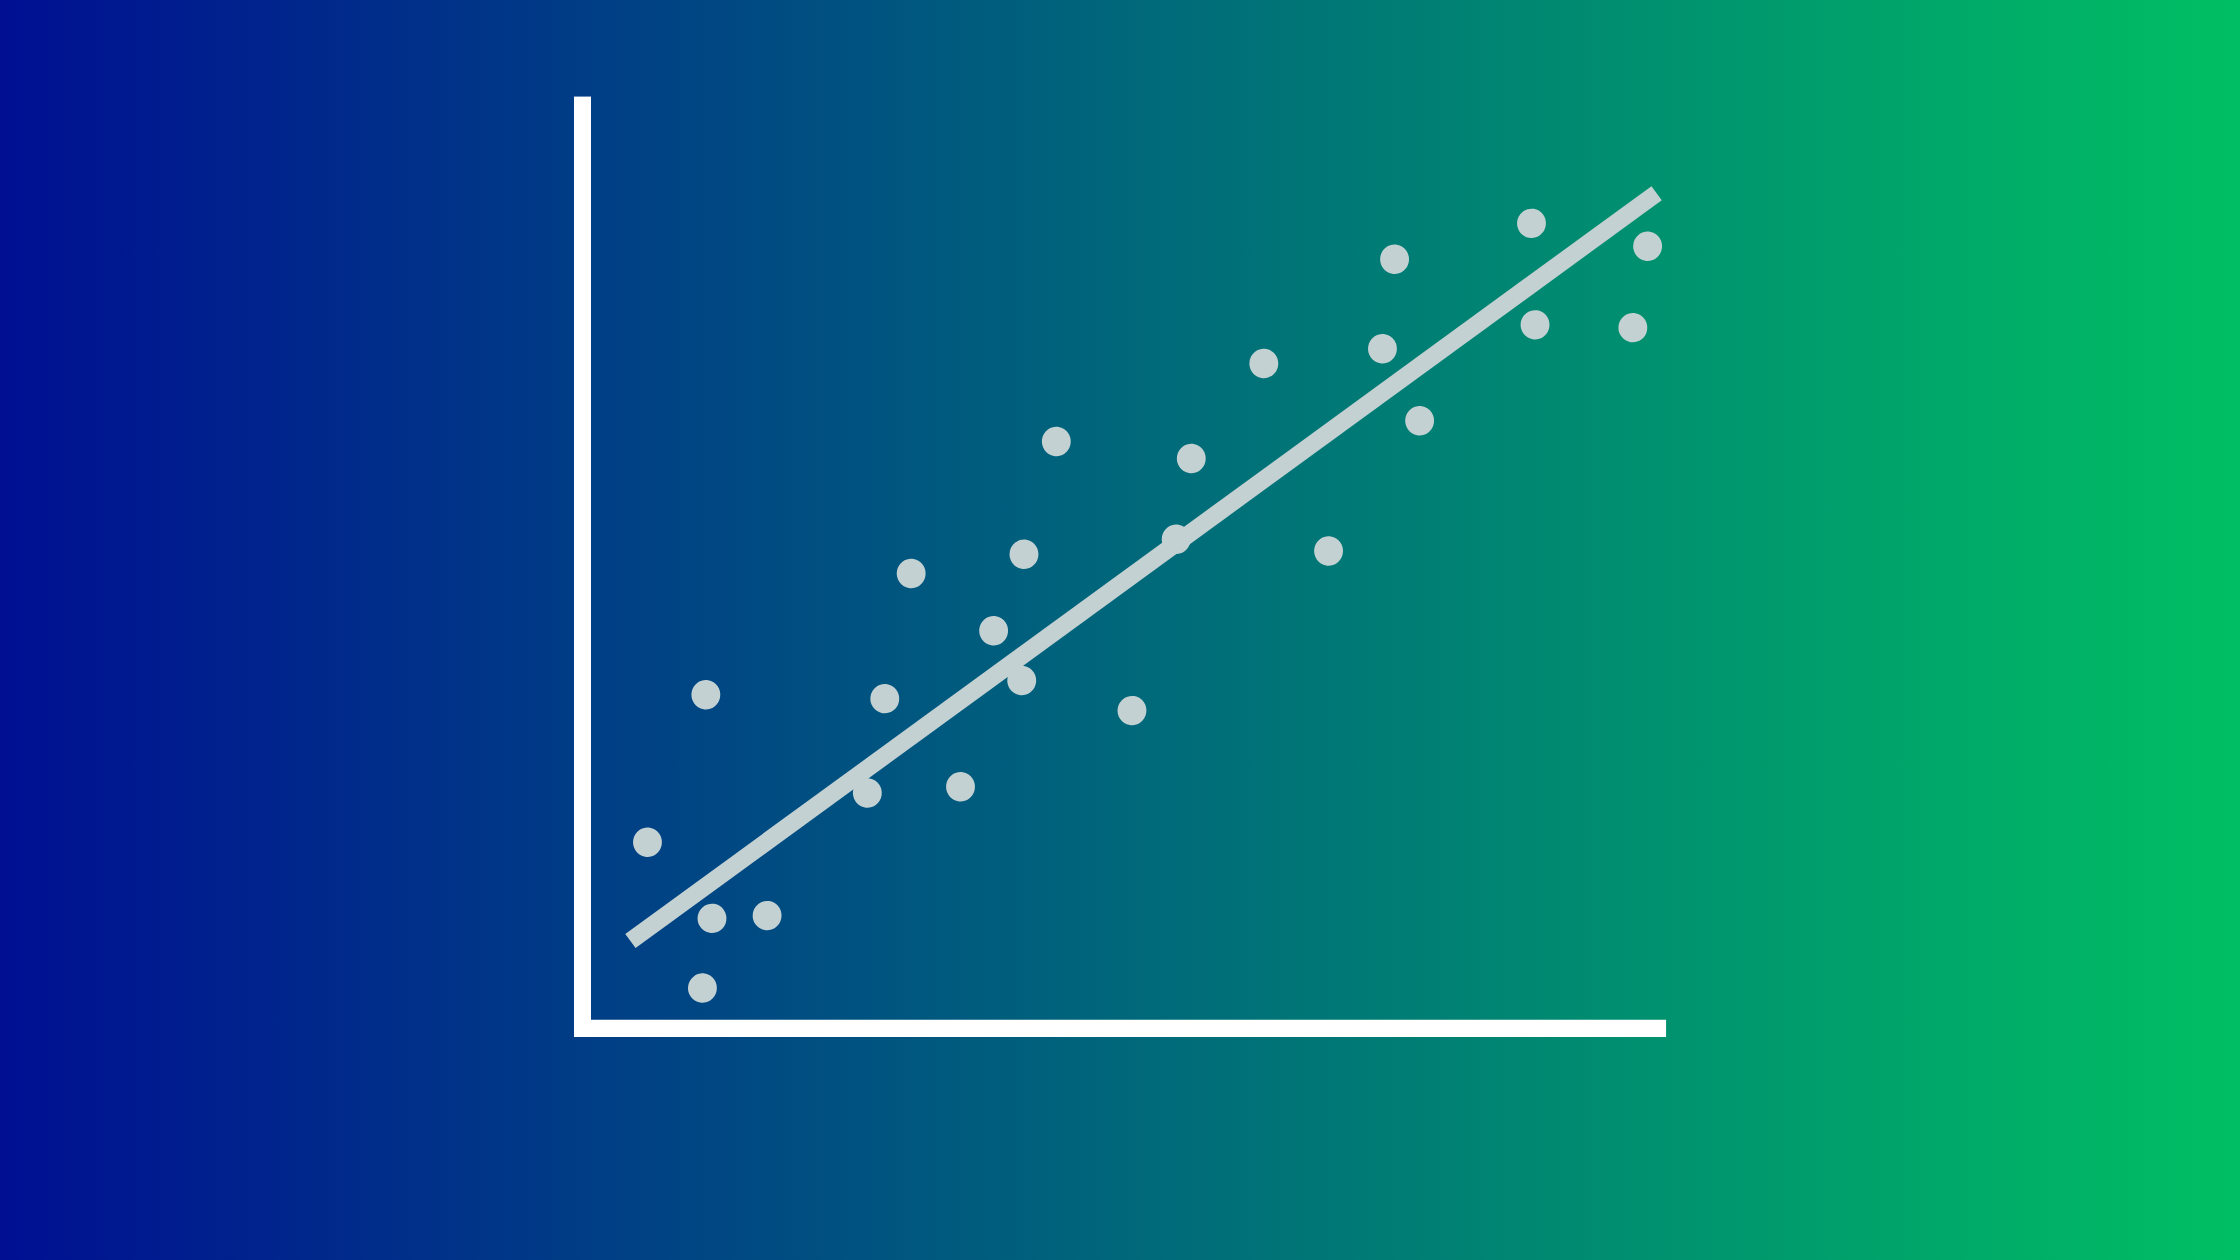
Analytics Essentials: Linear Regression
Linear regression analysis is a powerful statistical tool that provides valuable insights into the relationships between variables, supports predictive modeling, and facilitates evidence-based decision-making in various fields. It’s a great tool for marketers and data analysts to use when trying to understand if there is or is not a correlational relationship between a test factor and goal result.
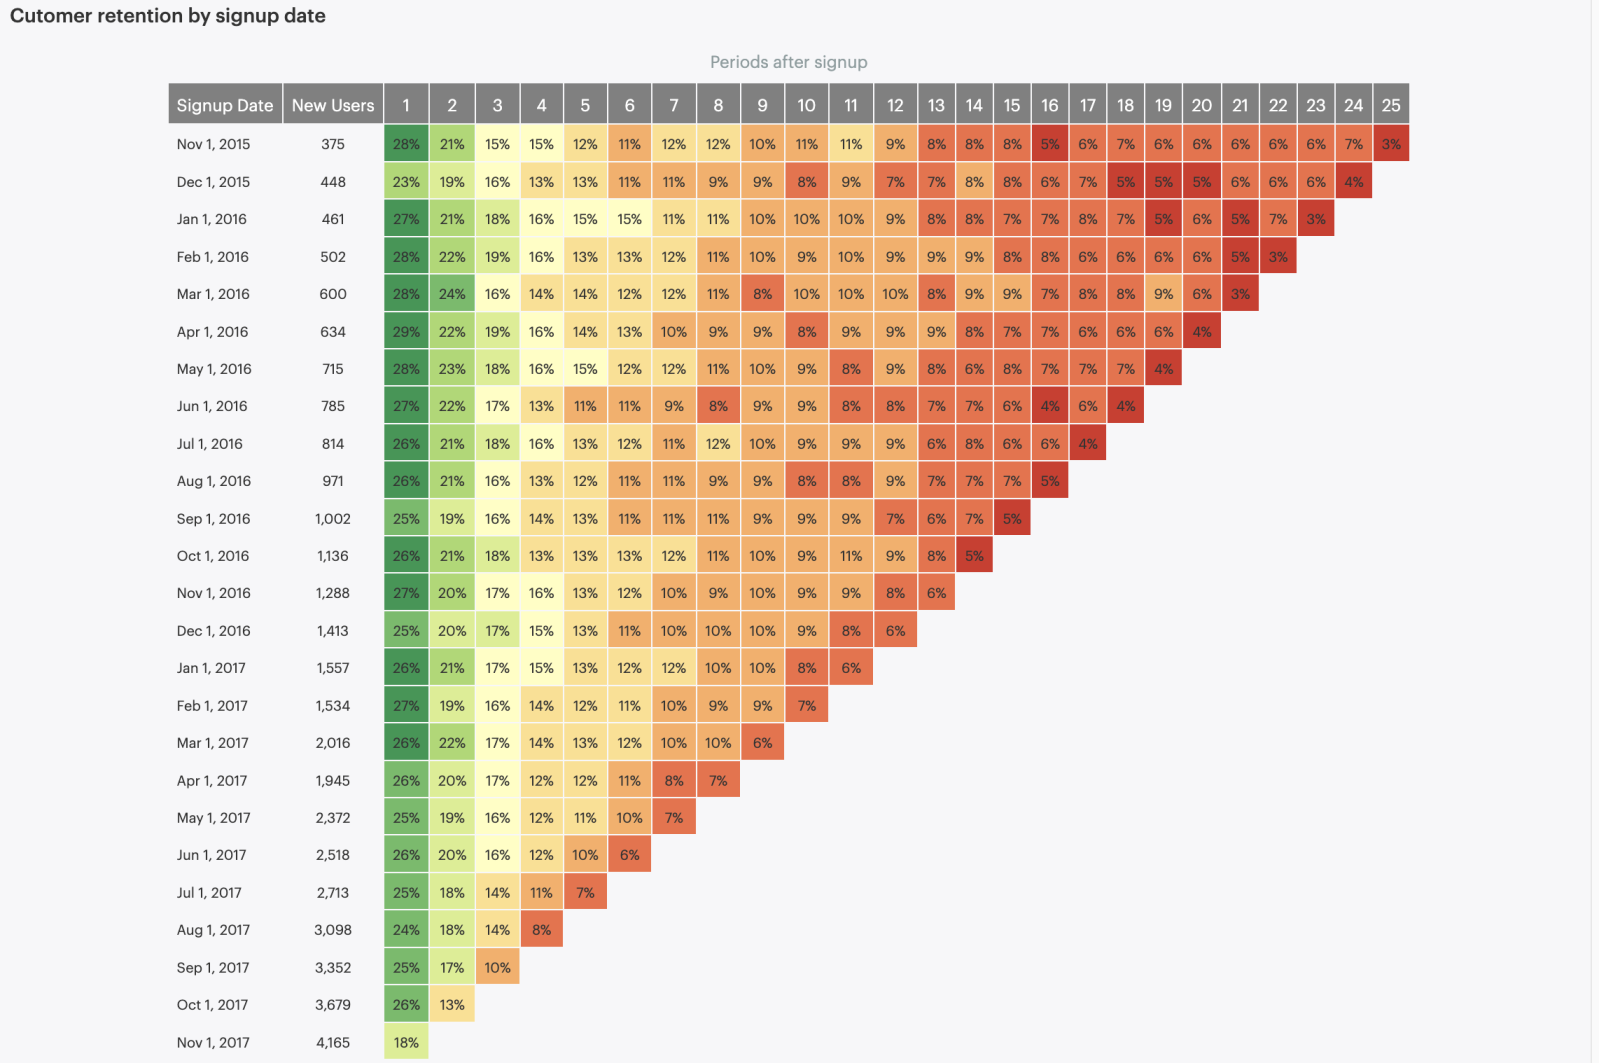
Analytics Essentials: How to Read & Use Cohort Charts
Master cohort charts (aka cohort analysis) and unlock the power of customer behavior data. These visualizations group users based on acquisition date and track their activity over time. Learn to read cohort charts and understand the role they play in helping you optimize your marketing strategy.

Analytics Essentials: The Master List
The Analytics Essentials Master List. Use this as an index for all our Analytics Essentials series blog posts.

5 Points to Consider When Choosing Influencer Marketing vs. Paid Social
Launching a brand? Choosing between influencer marketing and paid social can be tricky. This guide helps you navigate this decision by considering factors like goals, audience, resources, and storytelling. Often, the best approach is a blend of both!
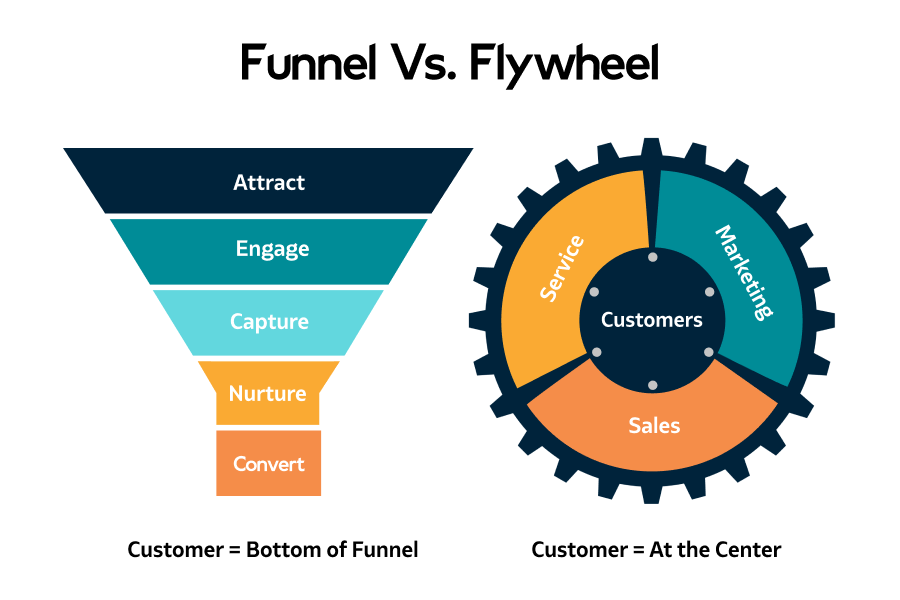
What is a funnel? Main strategies out there today for digital businesses
What is funnel marketing? How is it different from flywheel marketing? What are the best strategies to streamline your funnel marketing? In today’s article, we will discuss funnel marketing and essential strategies that companies can implement to streamline their business operations.
7 Top SEO Tools of 2023: A Comparison
Finding the best SEO tool that works best for your business is key to enhancing business performance. This blog covers the pros and cons of 7 of the biggest tools available in 2021.

21 Digital Marketing Terms To Know Before Starting
What is PPC and what are the most common terms to know when you’re starting out? Read up on these key terms, what they can mean for your advertising, and how to calculate all the important KPIs.

5 Ways to Deal with Designer’s Block
Just like writers and other professions, creatives of all fields can go through periods of designer’s block and even burn out. If you are having creative fatigue, here are some ways you can once again, become energized and refreshed in your work. Whether you’re a graphic designer, photographer, UI/UX designer, or videographer - these five tips can help you out of your creative rut.

8 Ecommerce Tips to Skyrocket Your Purchase Rate and Sales
If you have an online store or marketplace, check out these 8 tips that our Digital Gremlins put together to E-commerce owners win with users and make the sale.
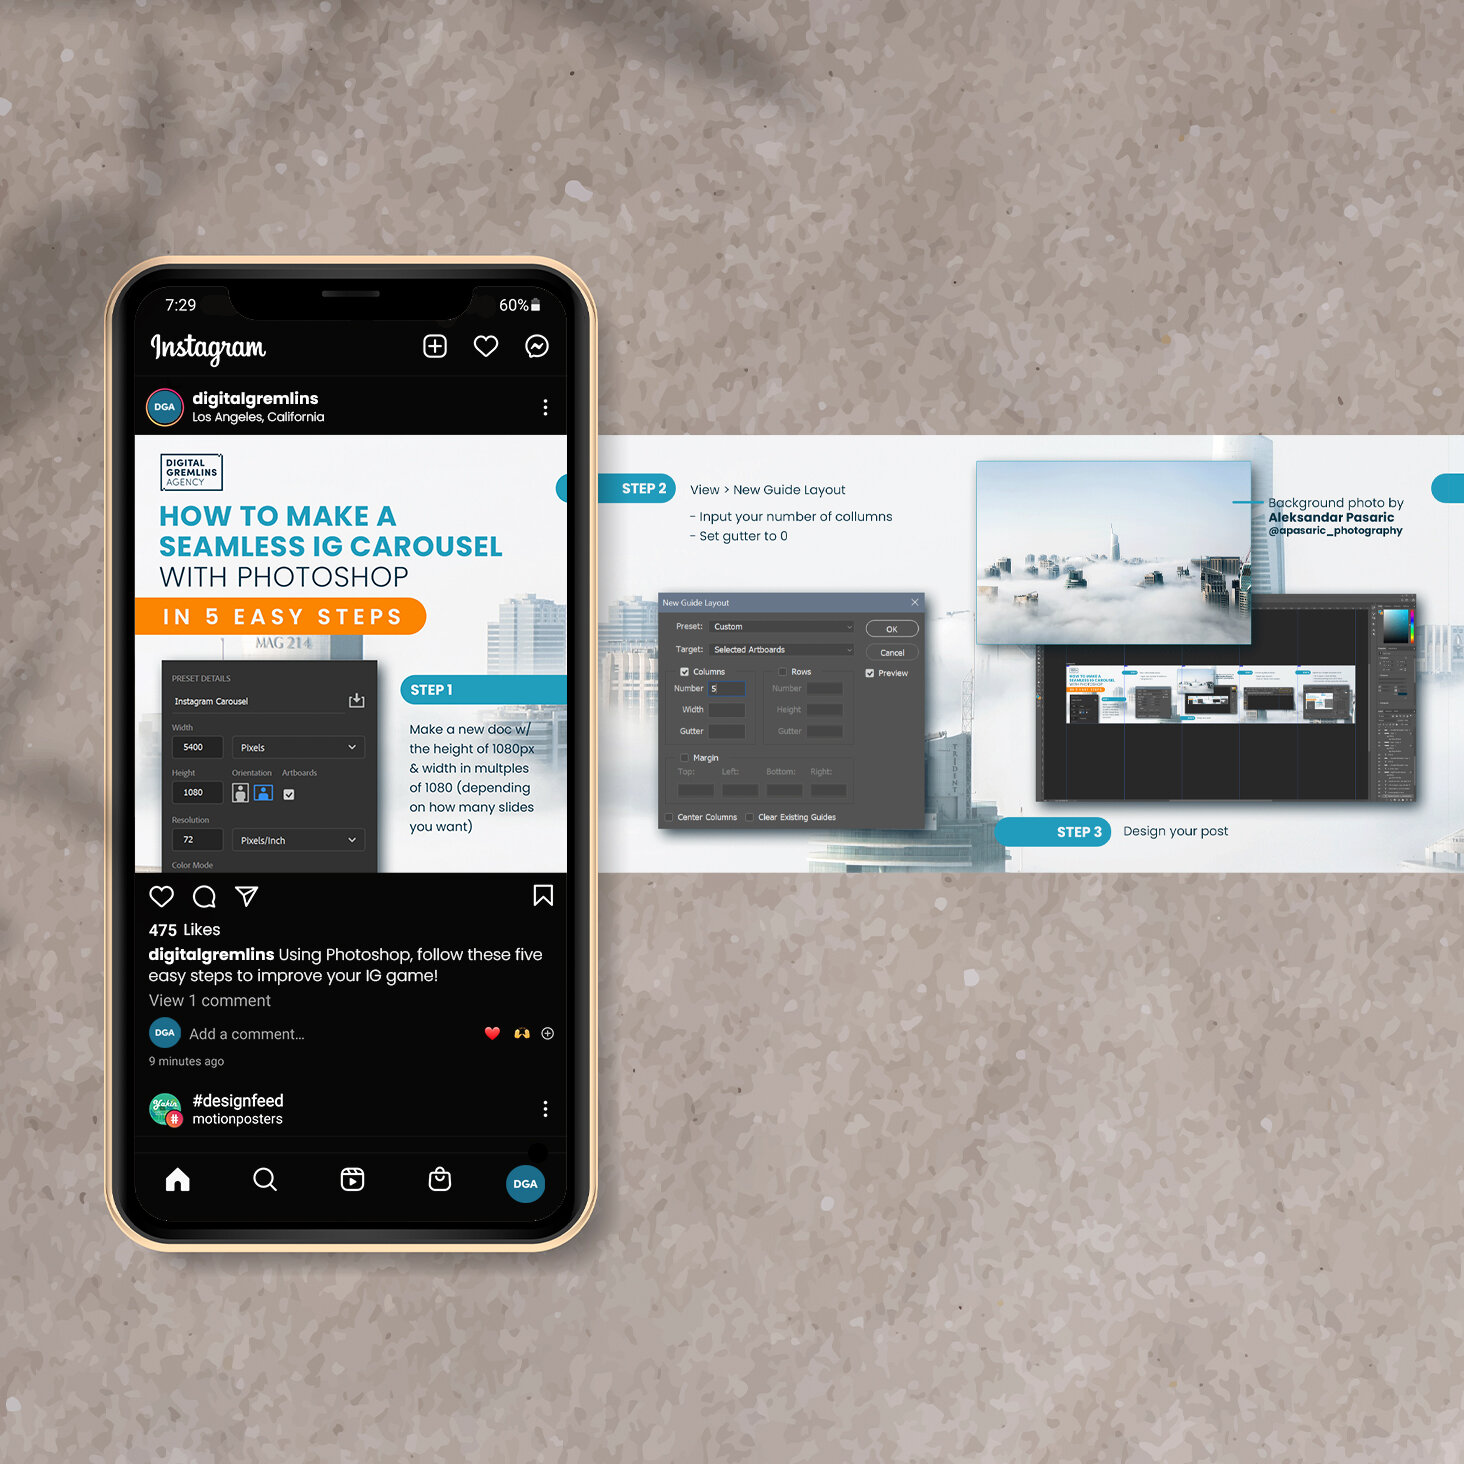
How to Make a Seamless Instagram Carousel in 5 Steps
A step-by-step tutorial of how to create seamless photo series on Photoshop (with images).